flowchart TB
    subgraph paper["newspaper front page"]
        direction TB
        p0(["full page"]) -- "strip style" --> p1(["content"])
        p1 -- "strip arrangement" --> p2(["data"])
        p2 -- "strip selection" --> p3(["state"])
    end
    subgraph dash["analytics dashboard"]
        direction TB
        d0(["full page"]) -- "strip style" --> d1(["content"])
        d1 -- "strip arrangement" --> d2(["data"])
        d2 -- "strip selection" --> d3(["state"])
    end
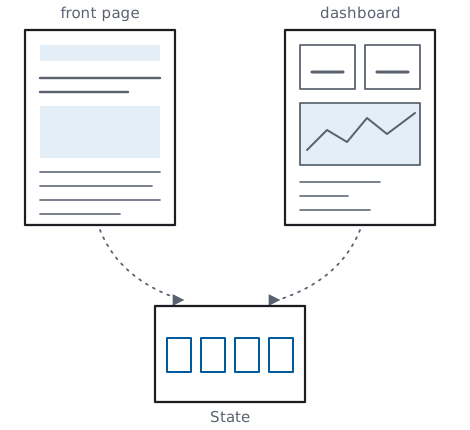
    p3 -.-> skel["Doc = Style × (Arrangement × (Selection × State))"]
    d3 -.-> skel
Chapter 3. Stripping the Page
The two pages are on the table — the newspaper front page and the wind-farm dashboard, as different a pair as Chapter 2 could find. Strip them, one layer at a time, and watch the same skeleton emerge from both. The exhibits below do exactly that, to real pages: the Guardian’s international front page and a Grafana wind-farm monitoring dashboard, captured on the same morning.
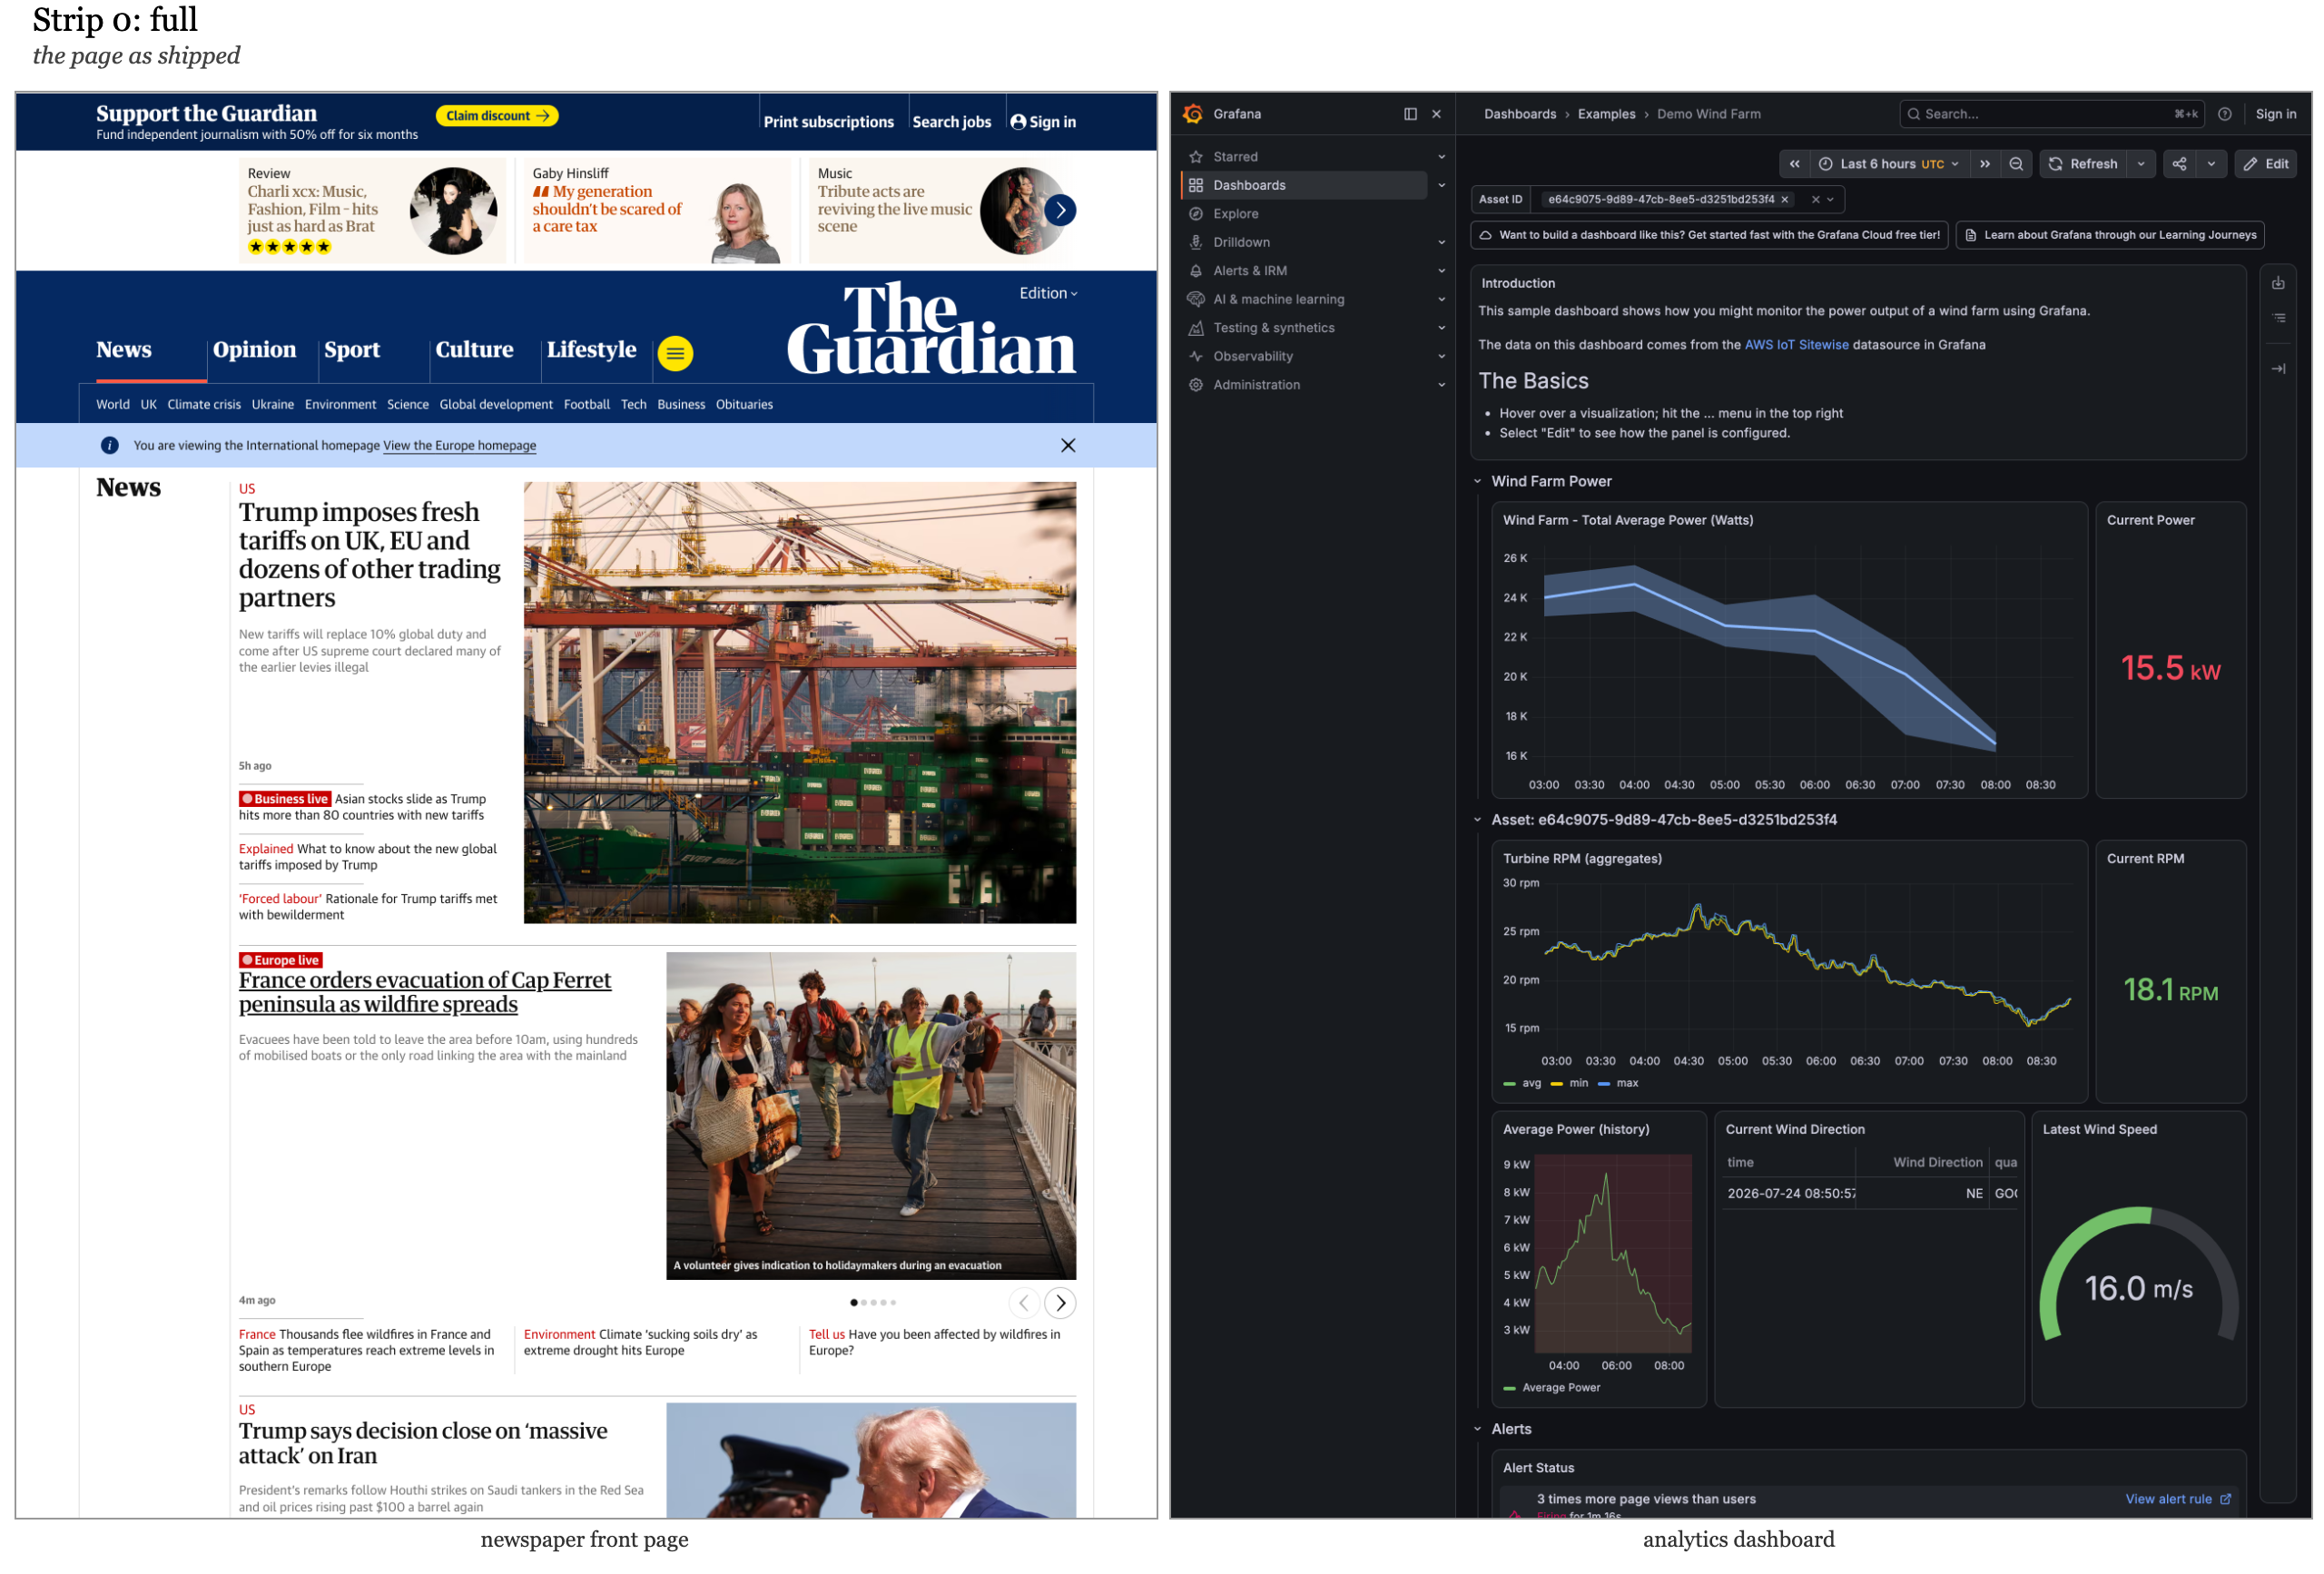
The starting material. One page is paper-white and editorial, the other black and numerical; they share, apparently, nothing.
Strip the style. Turn off CSS, switch to reader view, print in monochrome. The page looks different; nothing it says changes. So a document factors:
Doc = Style × ContentThe justification is already deployed on every device you own: dark mode, print stylesheets, reader view, accessibility themes — style varies while content holds fixed.
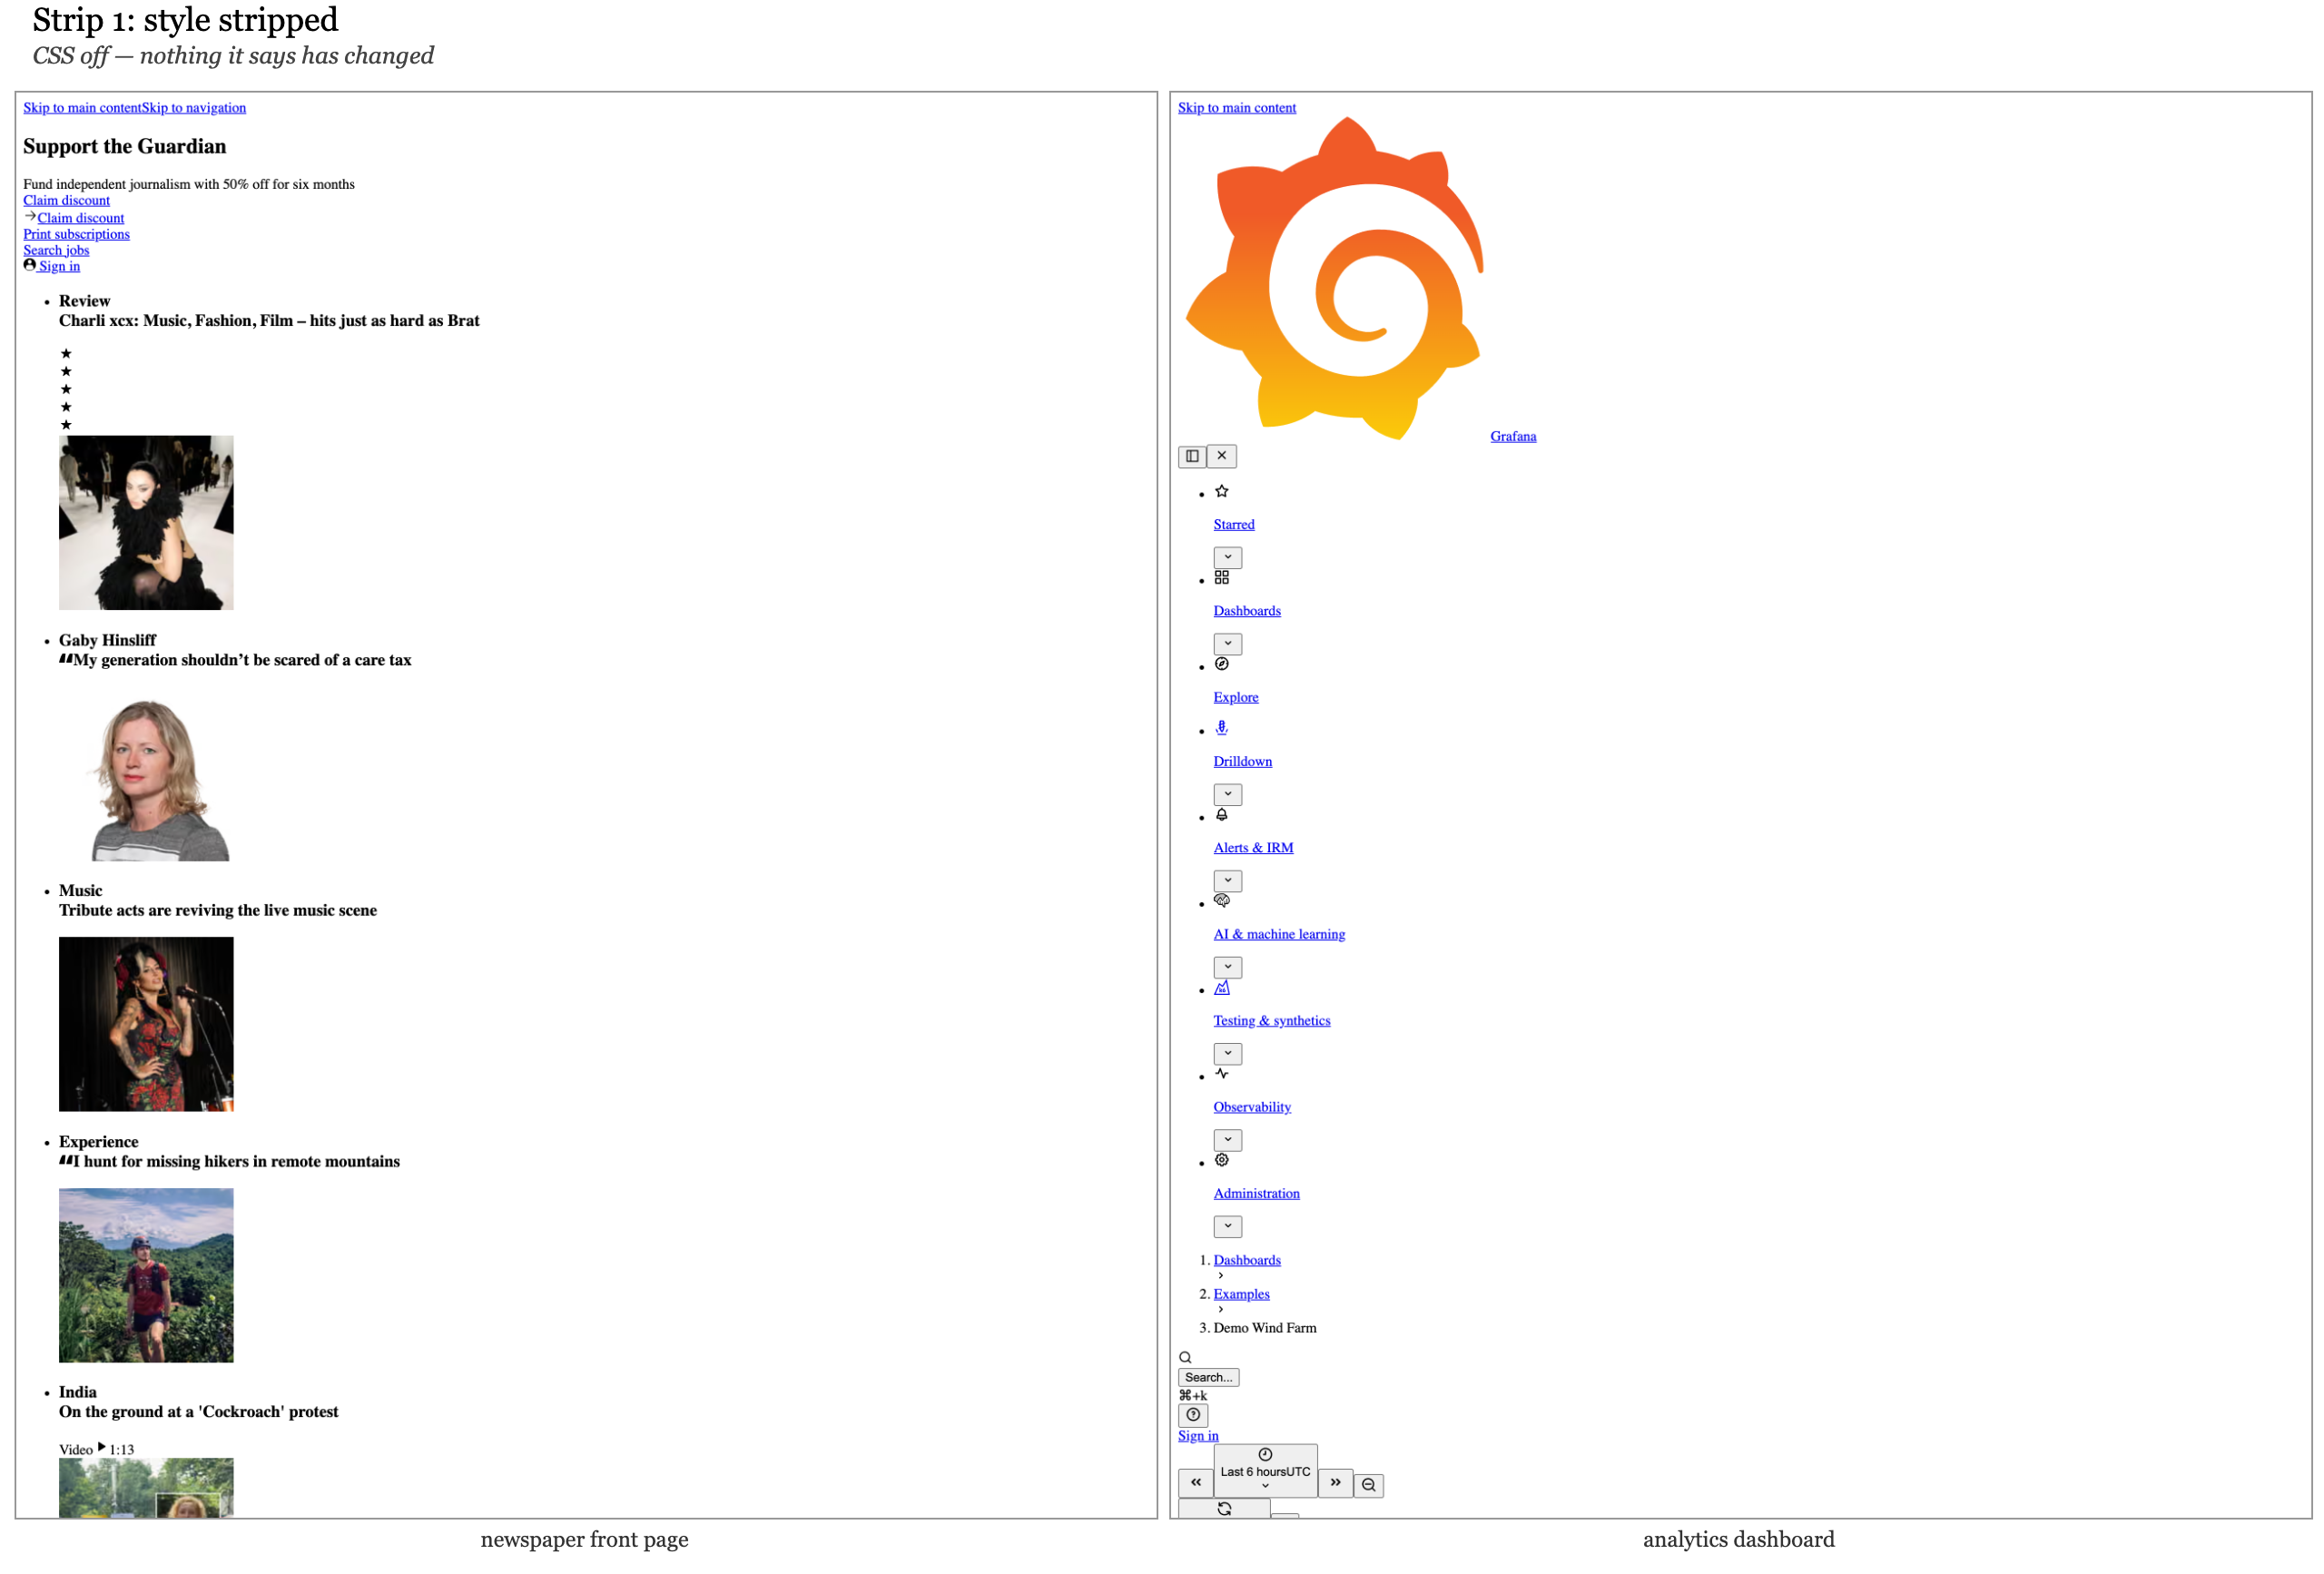
CSS off. The newspaper still says everything it said — headlines, bylines, photographs, in browser-default dress. Note the asymmetry on the right, and file it for Part IV: stripping style from the newspaper leaves the news; stripping it from the dashboard leaves mostly chrome. The headline numbers survive as text, but the time-series curves were never in the document at all — they are pixels on a canvas.
Strip the arrangement. The same content appears as a table on desktop, a card list on mobile, a chart in the summary view. The facts are identical; their shape as a document differs. So content factors:
Content = Arrangement × DataThe justification is every “view toggle” on the web: same data, different tree.
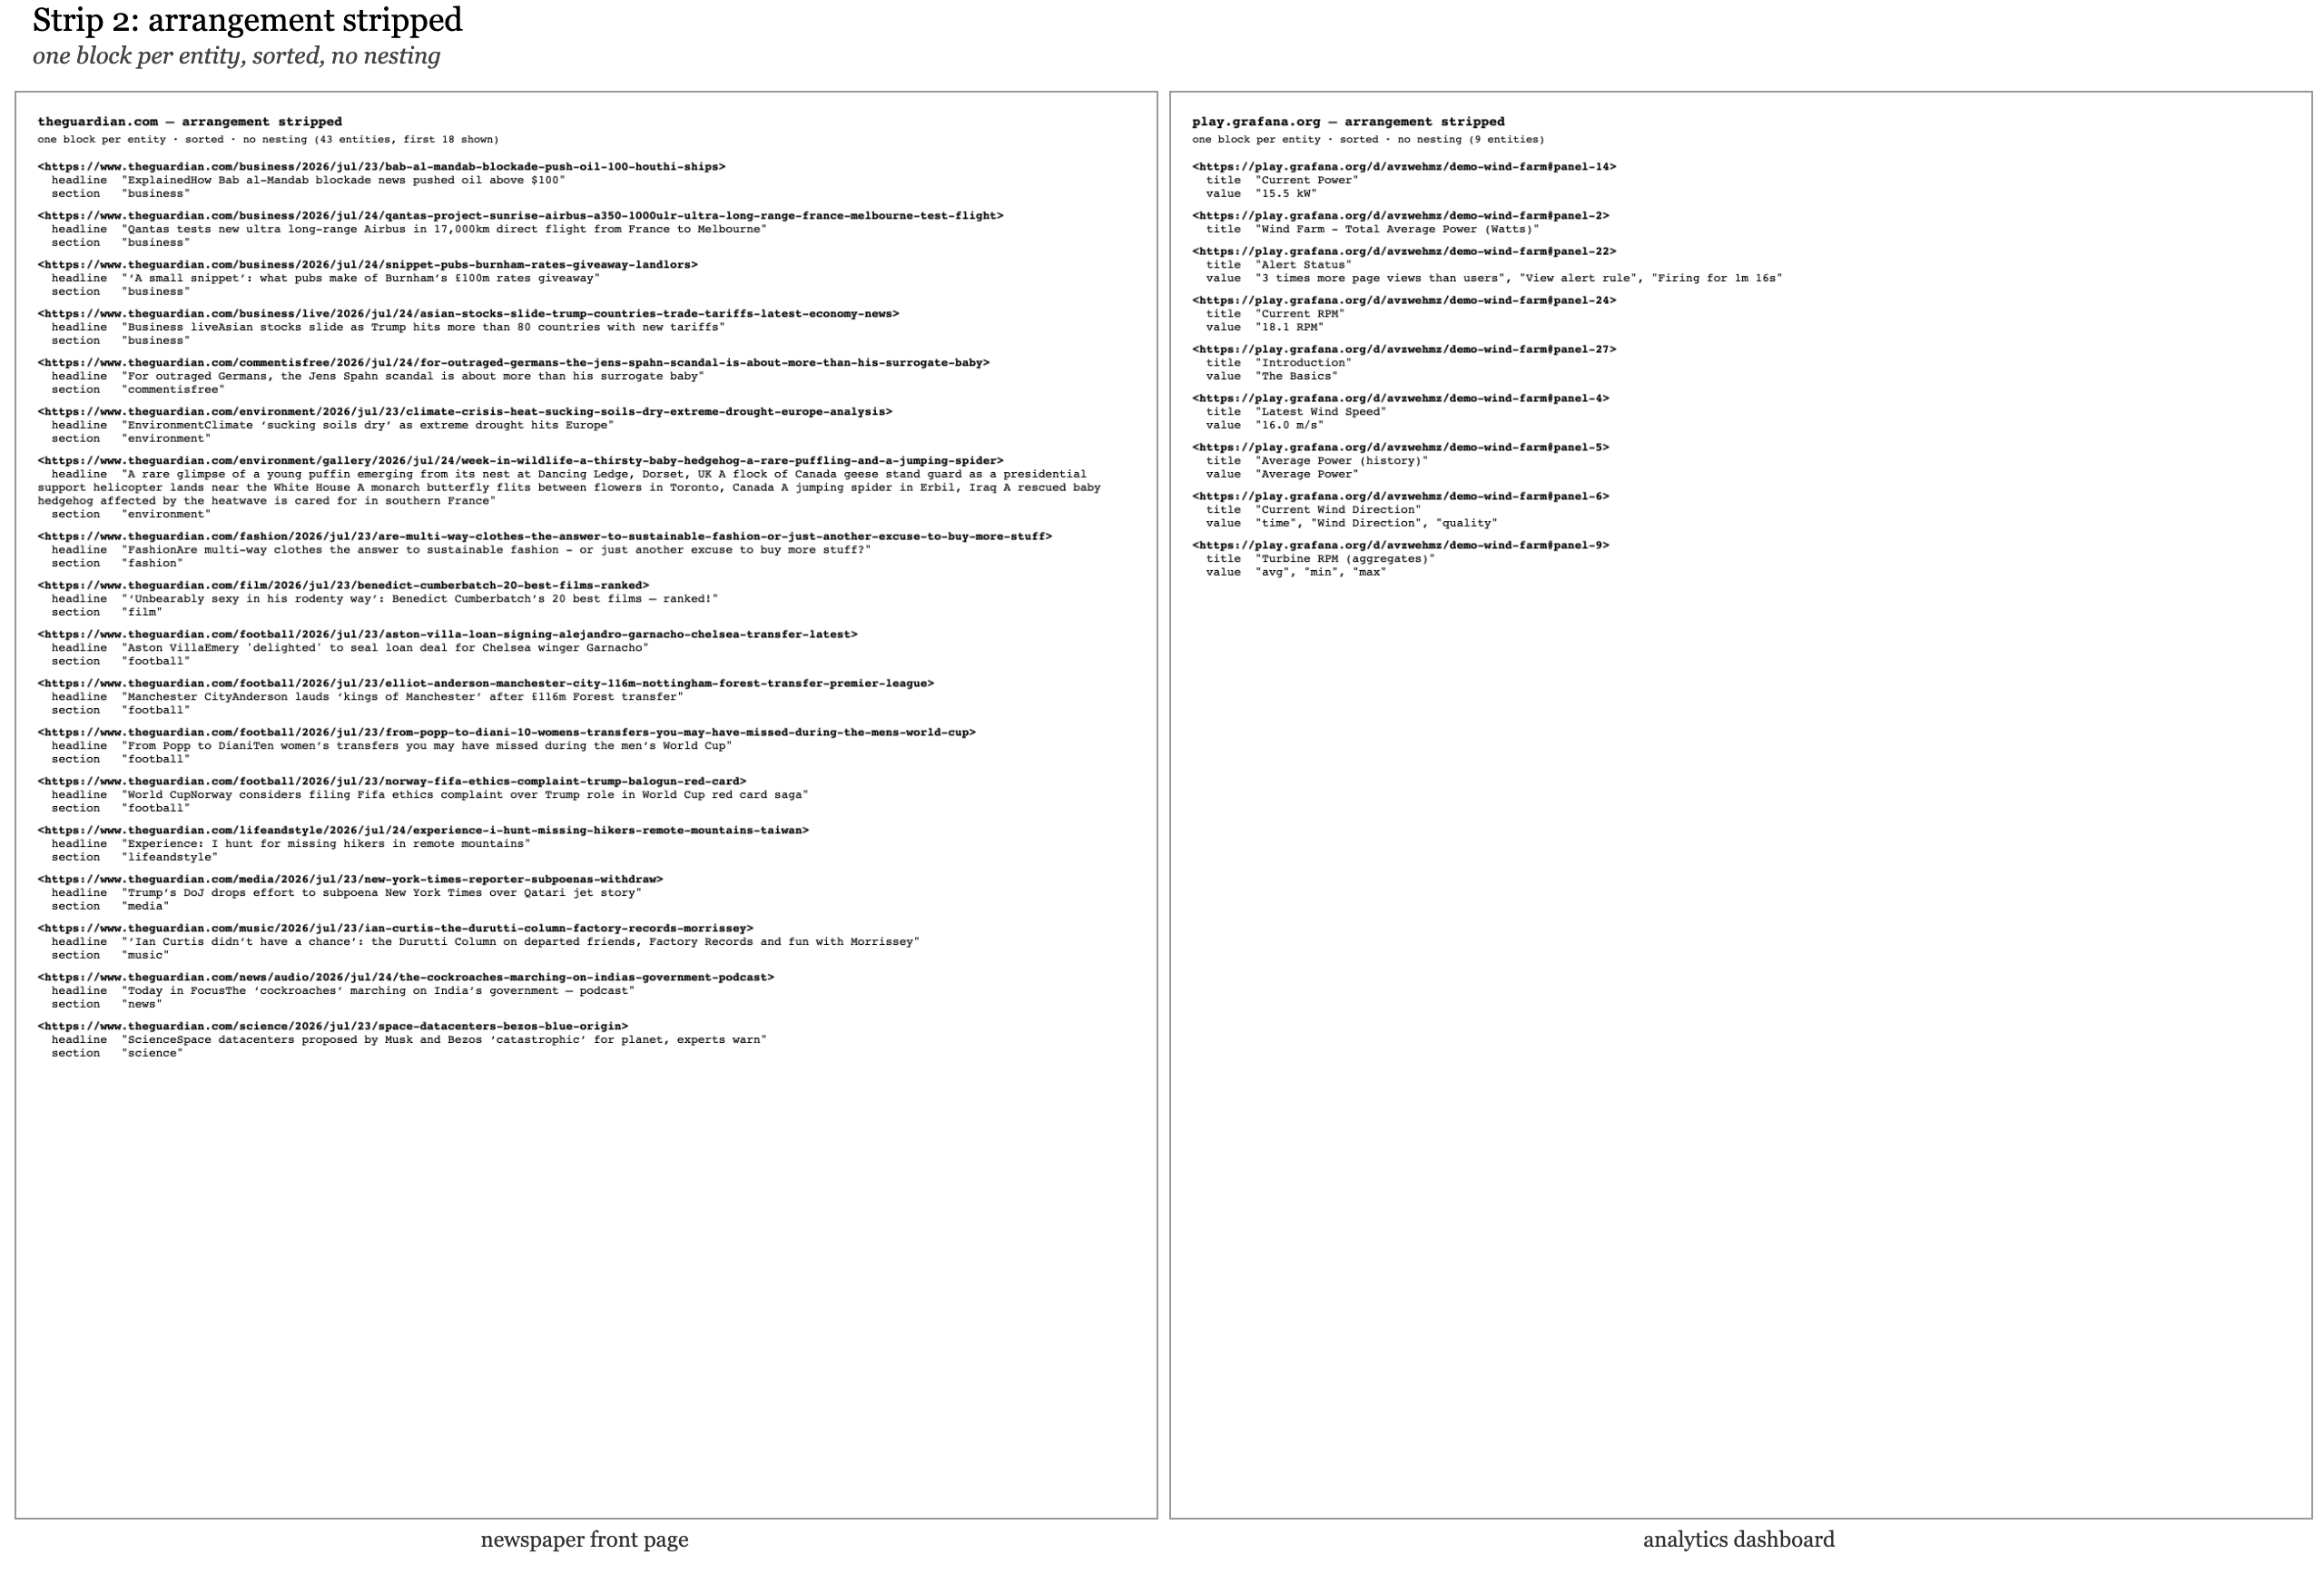
Arrangement off. Both pages now speak the same format: one block per entity, sorted, no nesting. A headline with a section; a panel title with a value. The two sites that shared nothing now differ only in vocabulary.
Order, evicted. Concede one catch before the next strip. A careful reader has already spotted it: the front page’s order means something. The lead story leads because an editor judged it should, and a strip that discarded the judgment would be destroying content while claiming to remove arrangement. The answer is that the judgment is a fact: this article, prominence one. The strip’s real effect is eviction: order moves out of the tree and into the data, where it survives every re-arrangement that follows. The deployed web already shows what happens otherwise: the same articles travel by feed, and the front page’s judgment does not travel with them. Prominence that lives only in an arrangement is lost on every consumer who receives the content without it. Chapter 6 will harden this from a concession into a law: if the order is a message, the order is data.
Strip the selection. Every page shows a sliver of something much larger. An article’s own page and the front page draw from the same pool; the dashboard shows the last six hours, but last week exists. So data factors:
Data = Selection × StatePagination, filters, search: deployed proof that the page is a window, not the world.
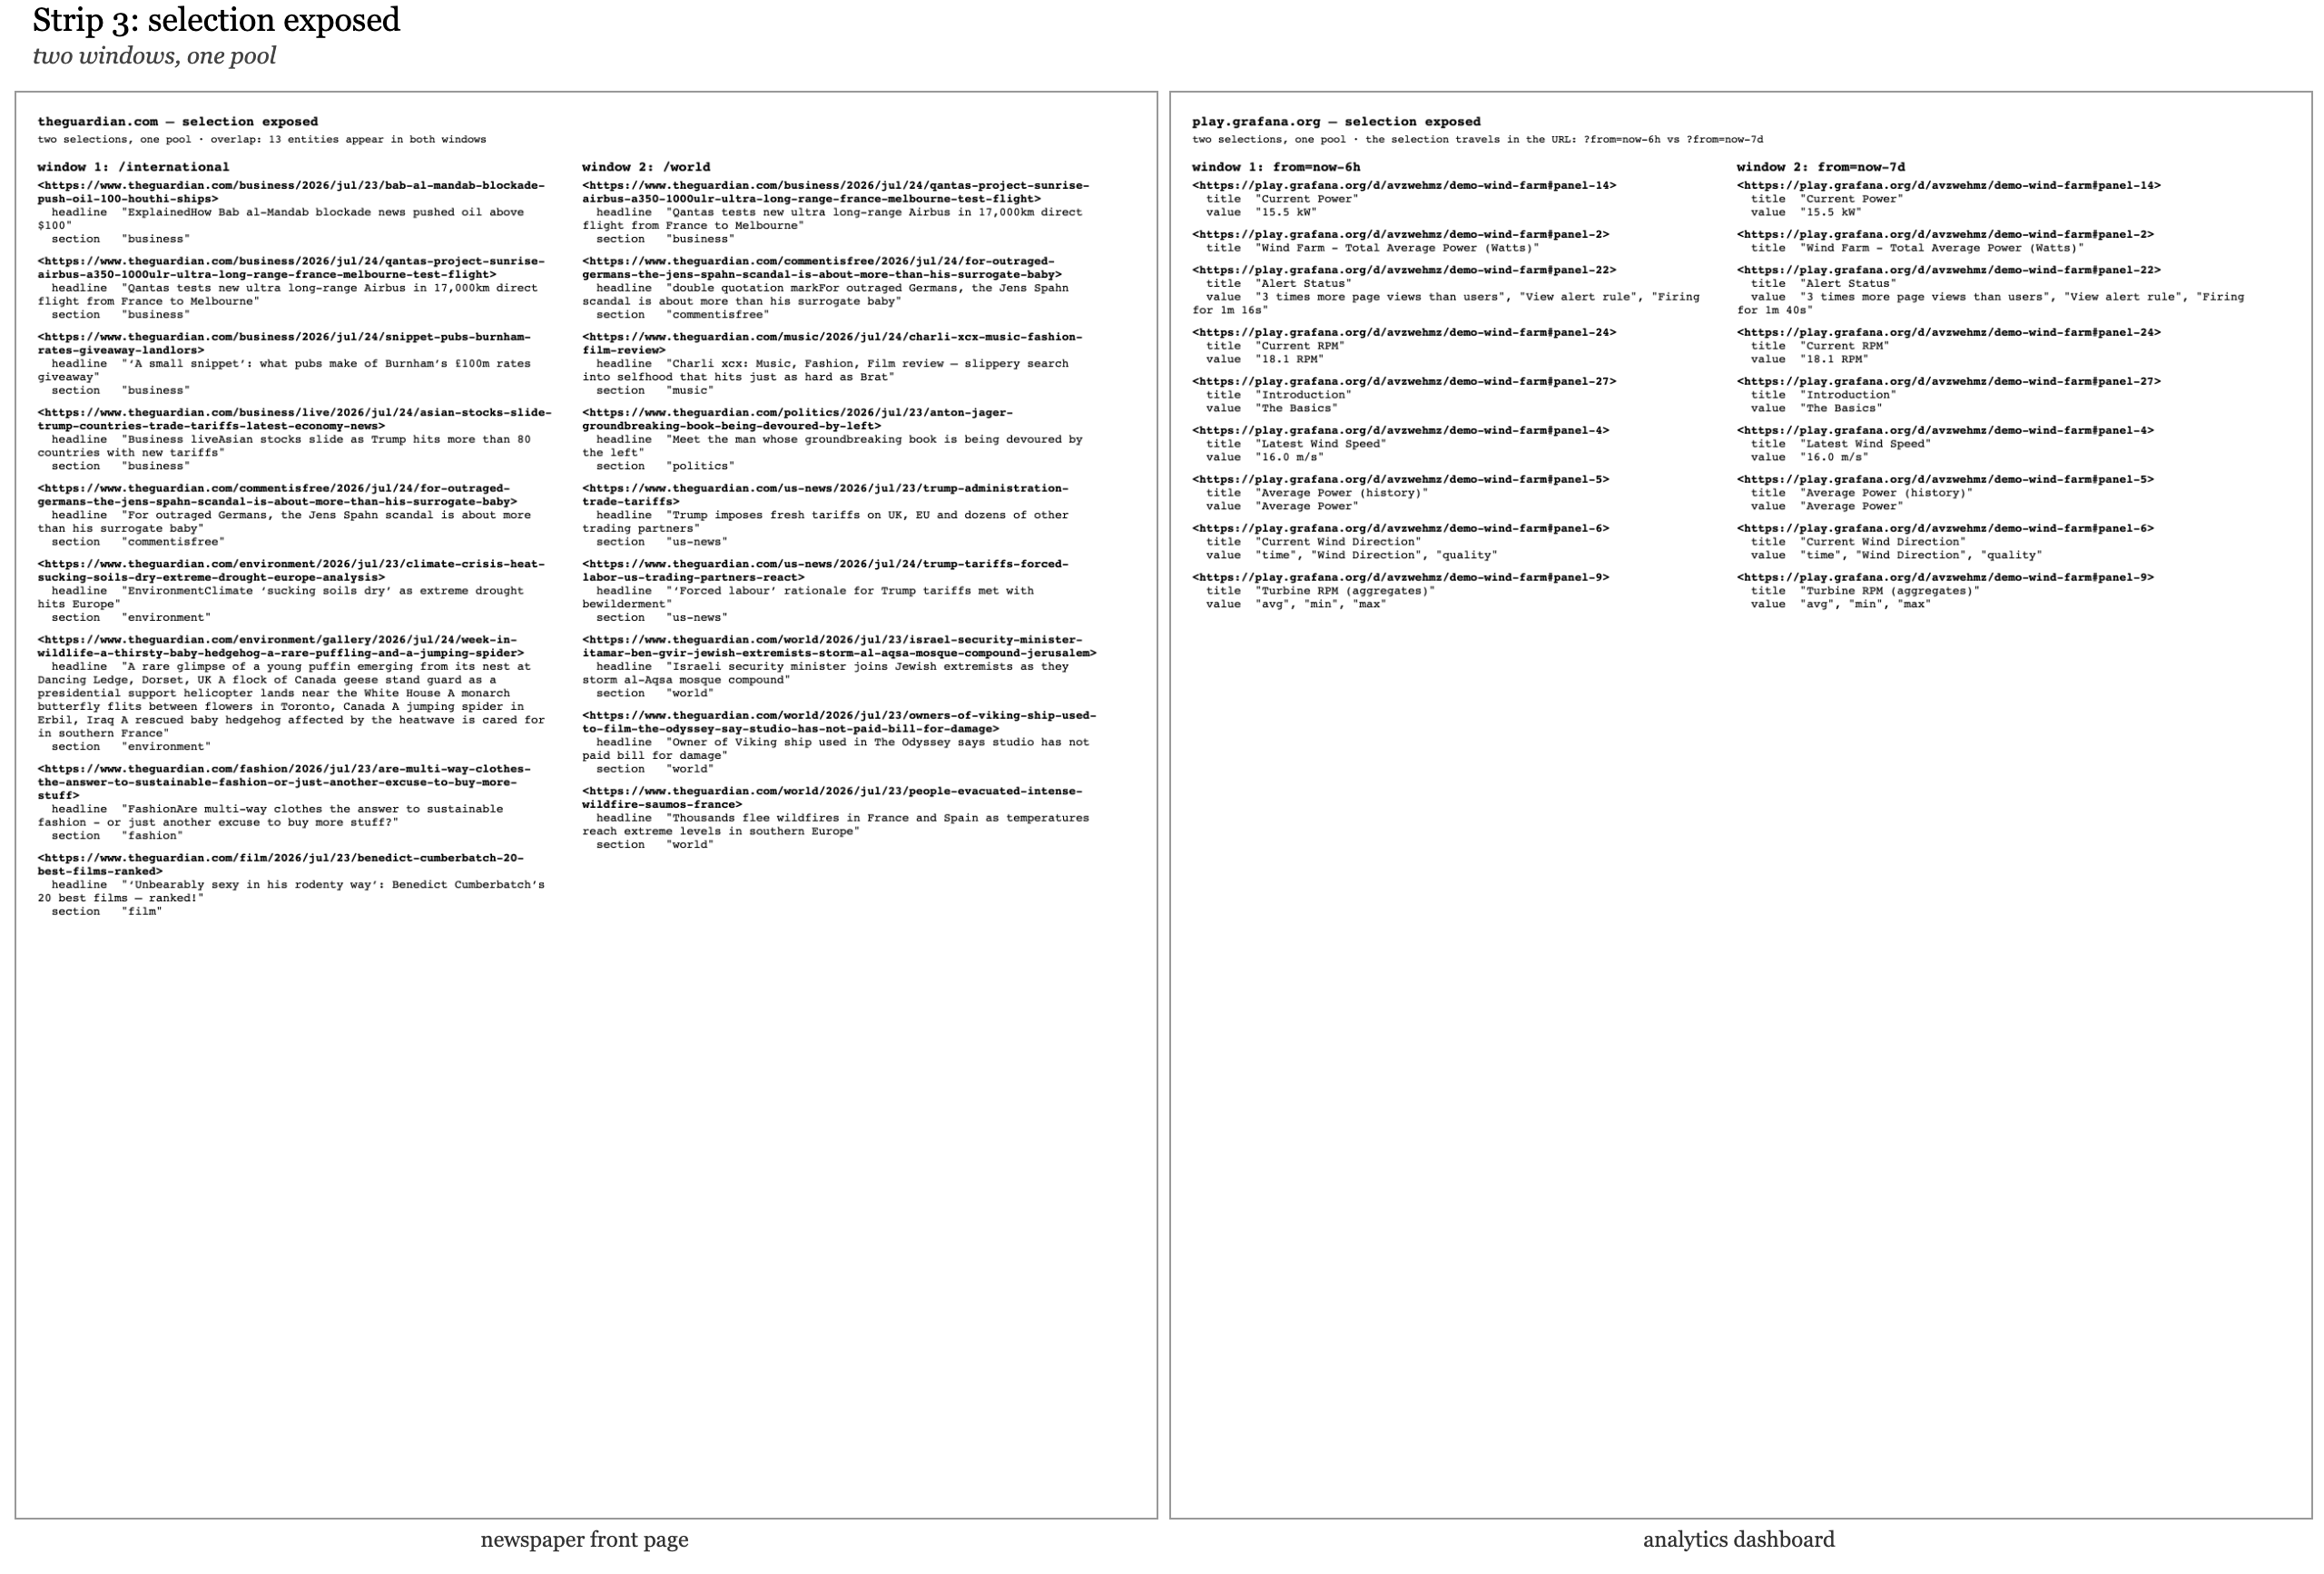
Selection made visible: two windows over one pool. On the left, /international and /world share 13 entities — the same articles, drawn twice. On the right, the same dashboard at ?from=now-6h and ?from=now-7d — the selection travels in the URL, in public, where anyone can change it.
Three strips, and both of our maximally different sites have reduced to the same expression:
Doc = Style × (Arrangement × (Selection × State))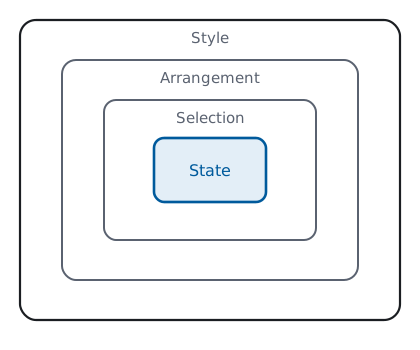
Two sites, three strips, one skeleton — the exhibits above, as a schematic.
Interactive exhibit (online edition): the strip, performed rather than photographed — the dashboard rebuilt live, each layer removed and restored in place.
Two examples prove nothing about all websites; the strips are illustration. The universal claim is Chapter 4’s theorem, quantifying over every read at once. This chapter makes you feel it; the next one proves it.