Charts
Interactive charts based on SPARQL queries
Charts can render results both types of SPARQL results:
- tabular
SELECTresults - graph results of
DESCRIBEandCONSTRUCT
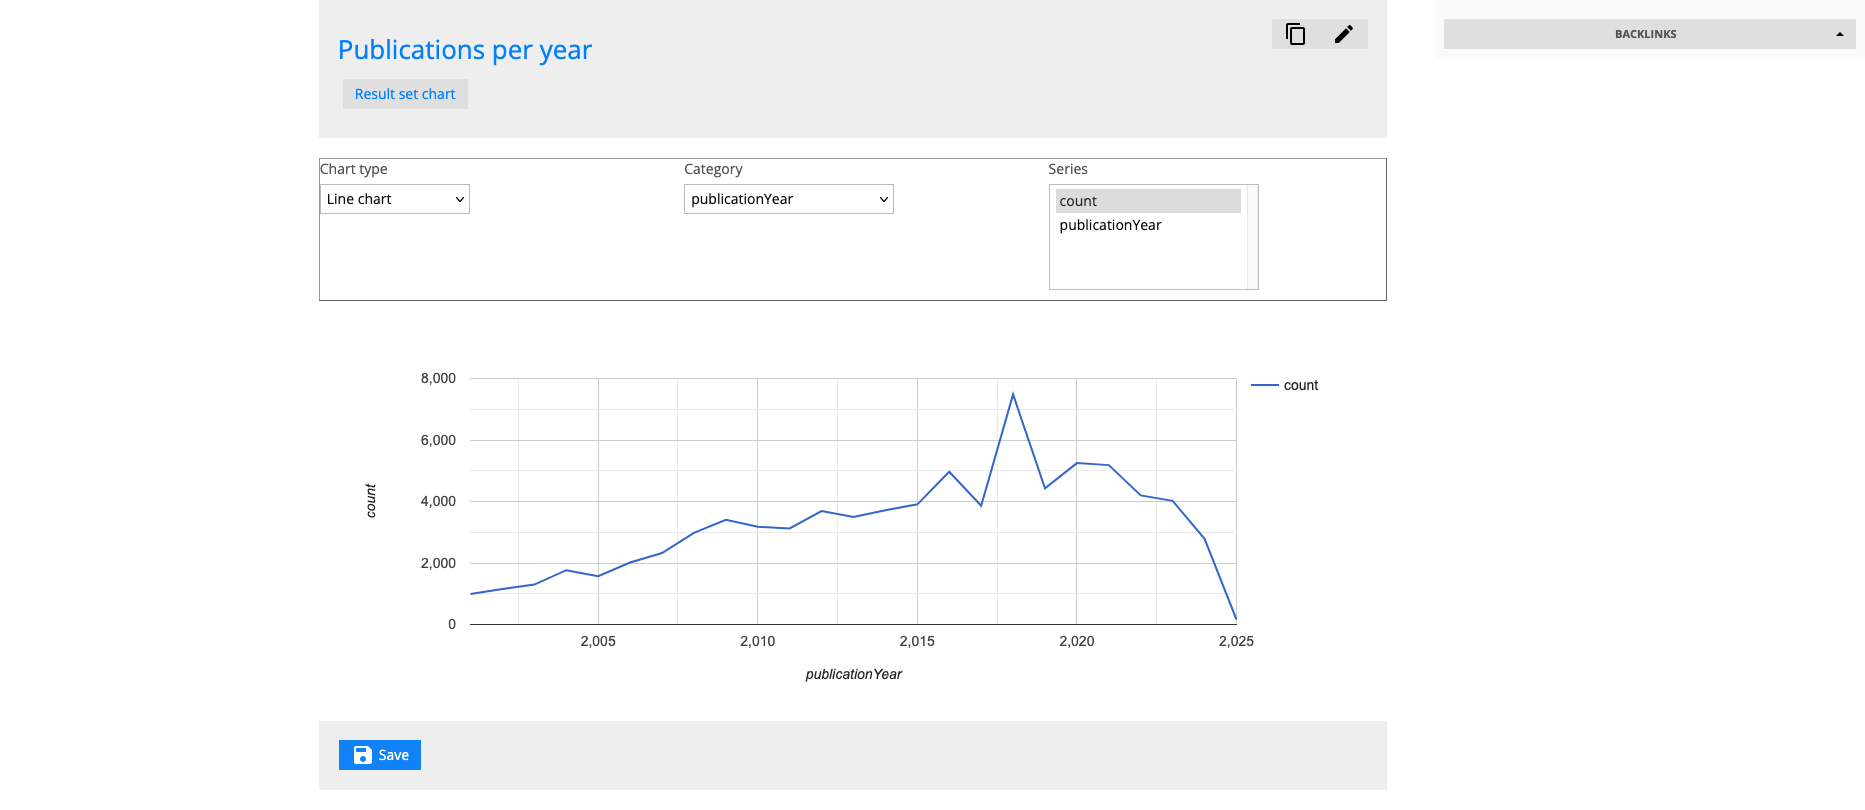
In that sense they are similar to the chart layout mode in views, but charts also store the chart type as well as the category and series information: variable names in the case of tabular results, and property URIs in the case of graph results.
The default chart type is the table. Other chart types might not apply to all result data; for example a scatter chart will need a numeric or datetime values for both category and series.